Using Optimization Insights
Optimization Insights helps you discover what's important in your data and take meaningful action. The Insights panel provides automatic insights generated by SegMetrics and allows you to ask questions about your data without creating complicated filters or custom reports. In this article, you'll learn how to access and use Optimization Insights to quickly answer common business questions.
Accessing Optimization Insights
You can open Optimization Insights from anywhere in SegMetrics:
- Navigate to the left-hand menu in your SegMetrics account.
- Under the Resources section, click Tools to expand the menu.
- Select Insights from the expanded options.

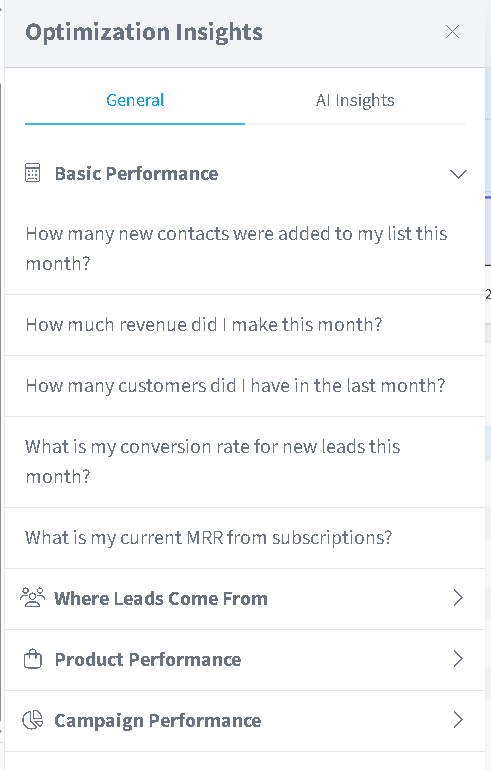
The Optimization Insights panel will open, displaying two tabs: General (for common business questions) and AI Insights (for automated trend detection).
Understanding Insight Categories
Insights are organized into four main categories to help you quickly find relevant information:
Basic Performance - Answers fundamental questions about your business metrics, such as:
- How many new contacts were added to my list this month?
- How much revenue did I make this month?
- How many customers did I have in the last month?
- What is my conversion rate for new leads this month?
- What is my current MRR from subscriptions?
Where Leads Come From - Provides insights into your lead sources and acquisition channels.
Product Performance - Shows data about individual product performance and revenue generation.
Campaign Performance - Reveals metrics about your marketing campaign effectiveness.
Viewing Insight Answers
To view the answer to any insight question:
- Click on one of the four category headers (**Basic Performance**, Where Leads Come From, Product Performance, or Campaign Performance).
- The category will expand to show common questions you can ask about your data.
- Click on any question to display the answer.
The insight will show:
- You Asked: - The specific question you clicked on
- The metric value displayed prominently in large numbers (such as 1,238 leads or revenue amount)
- Percentage change compared to the previous period (shown in red for decreases or green for increases)

Opening Full Reports
If you need more detailed information or want to explore the data further:
- After clicking on an insight question to view the answer, look for the View Report button below the metric display.
- Click View Report to open the complete report with full filtering, segmentation, and export capabilities.
This allows you to transition seamlessly from a quick insight to deeper analysis without having to manually navigate through your reports or recreate filters.
FAQs
Q: What's the difference between General insights and AI Insights?
A: General insights provide answers to predefined common business questions organized by category. AI Insights automatically detect unusual trends, changes, and opportunities in your data (such as an unusually low number of new users) and alert you proactively.
Q: Can I suggest new questions for the Insights panel?
A: Yes! SegMetrics welcomes feedback for new insights and questions. You can reach out through the notification beacon on the right side of the app or contact support@segmetrics.io with your ideas.
Q: Do insights update in real-time?
A: Insights reflect your current data based on the date ranges shown. While not instantaneous, they update regularly to provide current information about your business performance.
Q: Can I customize the date range for insights?
A: Individual insight answers show data for specific date ranges. To analyze different time periods or apply custom filters, click "View Report" to open the full report where you have complete control over date ranges and filtering.
Q: How are the percentage changes calculated?
A: Percentage changes shown in insights compare the current period's metric to the same metric in the previous period of equal length. For example, if viewing data for the current month, the percentage shows the change compared to the previous month.