Dashboard Templates
Dashboard templates allow you to deploy a custom dashboard with just a few clicks. Need a dashboard to monitor your lead value over time, check in on your ads performance, track a product launch, or see how many calls you've booked? Our dashboard templates are beneficial and easy to use, providing pre-configured widgets for common business scenarios.
Requirements
- An active SegMetrics account
- Connected data sources (CRM, email marketing tools, etc.)
- Existing reports and data in your SegMetrics account
Deploying a Dashboard Template
Follow these steps to deploy a dashboard template:
- Login to SegMetrics - Access your SegMetrics account
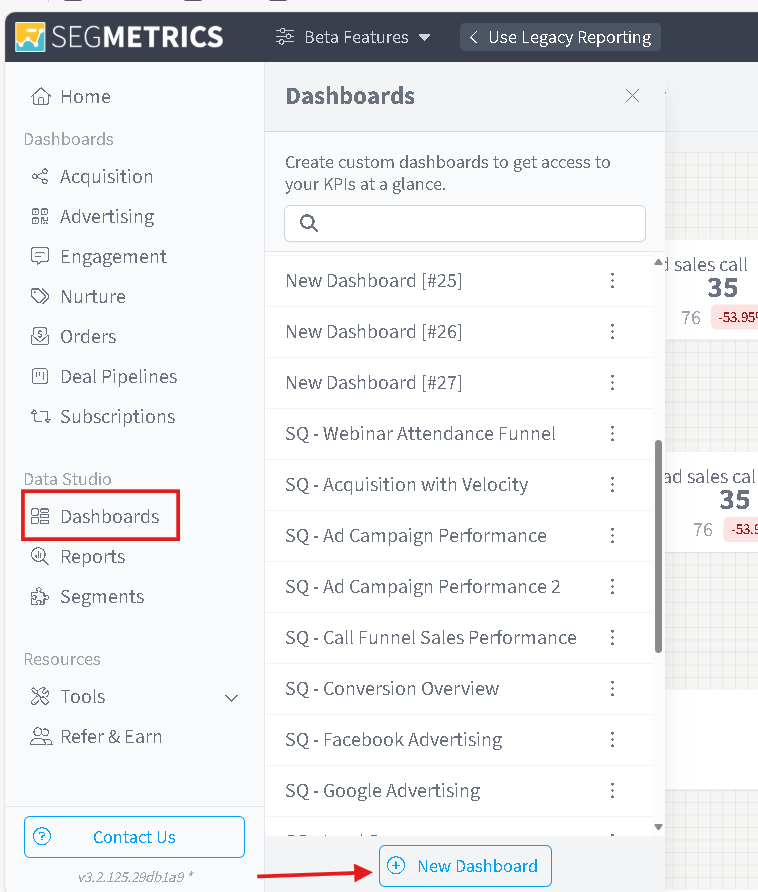
- Navigate to Dashboards - Click Dashboards from the left sidebar
- Create New Dashboard - Click New Dashboard
- Select Template Option - Click Select a Template
- Choose Template Type - Select the type of dashboard you'd like to deploy
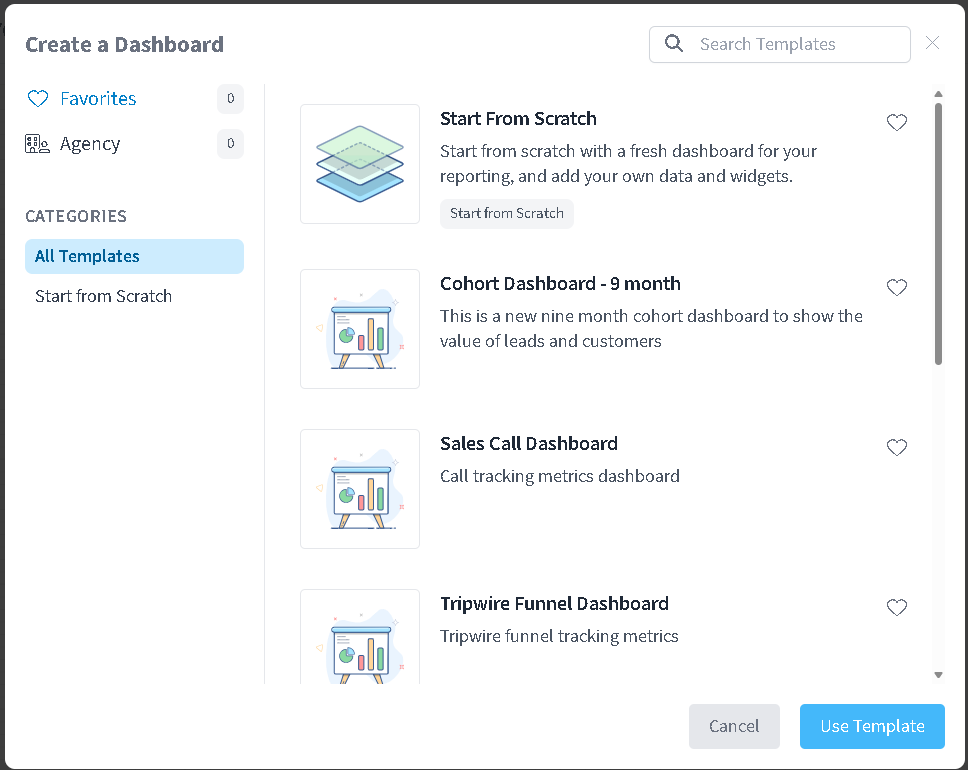
- Deploy Template - Click Use Template
Once deployed, you'll see specific instructions that guide you through using the template, including variables such as tags or other properties needed in your funnel to display metrics properly.
If you dont want to use a template, select Start From Scratch
Available Dashboard Templates
Cohort Dashboard - 9 Month
This dashboard template helps measure the value of your leads over time by grouping leads into time-based cohorts over a 9-month period.
Setup Requirements: No additional instructions needed. You should start seeing data quickly, though you can implement filters to widgets as needed.
Sales Call Dashboard
Optimize your sales calls by understanding where people fall out of your funnel and which lead sources bring the most qualified leads.
Setup Requirements: Apply a tag to all contacts who book a call with you or your sales team. This allows accurate tracking of bookings and sales team performance.
Tripwire Funnel Dashboard
Track your tripwire funnel performance from initial offer through upsells and customer lifetime value progression.
Setup Requirements: Apply specific tags to contacts at each stage of your tripwire funnel. Update each widget with the appropriate tags for accurate tracking.
Acquisition Overview
Monitor your lead acquisition across all channels with comprehensive metrics on lead sources, costs, and conversion rates.
Setup Requirements: No additional instructions needed. Data is pulled directly from standard advertising and acquisition reports, including ad spend, leads, customers, and cost per acquisition.
Conversion Overview
Track conversion metrics across your entire funnel, from initial lead capture through final purchase and beyond.
Setup Requirements: Ensure proper tagging at each conversion point in your funnel. Update widgets with relevant conversion tags and goals.
Exit Dashboard Template
Identify where prospects are leaving your funnel and implement strategies to reduce exit points and improve overall conversion rates.
Setup Requirements: Configure exit point tracking tags throughout your funnel. Customize widgets to reflect your specific funnel stages and exit criteria.
Customizing Your Template
Modifying Widgets
- Edit Configuration - Double-click any widget to view and edit its settings
- Update Tags - Modify widgets to accommodate your existing tag structure
- Adjust Filters - Add or modify filters to focus on specific segments or time periods
- Change Metrics - Select different KPIs that better match your business goals
Adding Instructions Context
Each template includes contextual instructions. For example, the Sales Call template suggests applying a "Booked a Call" tag to contacts in your marketing funnel, which SegMetrics pulls from your CRM or email marketing tool.
Sharing Your Template
Once you've customized your template, you can share it with colleagues or clients, whether they have SegMetrics access or not. See our Sharing Custom Dashboards guide for detailed instructions.
Note: When you share a dashboard link, recipients cannot edit widgets or data - they have view-only access.
Frequently Asked Questions
Q. Can I modify a template after deploying it?
A. Yes! Templates serve as starting points. You can customize widgets, add new ones, modify filters, and adjust any settings to match your specific business needs.
Q. What if I don't have the required tags mentioned in the instructions?
A. You can either create the suggested tags in your marketing funnel or modify the template widgets to work with your existing tag structure. Double-click any widget to update its configuration.
Q. Can I make my own template?
A. Yes. If you're and agency and have multiple accounts this can be very useful. Make sure you save your custom dashboard that you created. Contact support and include the URL of that dashboard in your request to create your own template.
Q. How quickly will data appear in my template dashboard?
A. For templates with no setup requirements (like Cohort Dashboard and Acquisition Overview), data should appear immediately. Templates requiring specific tags will show data once you've implemented the required tagging in your funnels.