Funnels Report
The Funnels report tracks your contacts through the important touch points of your funnel. Each individual Funnel can report on up to 6 of the most important milestones of your funnel.
Create a New Funnel Report
When you do something specific, you’ll get a specific result.
To create a new Funnel report:
- From the left sidebar, click Funnels
- Configure the top of funnel Base Cohort
- Configure up to 5 other steps for the funnel report
Base Cohort Step
Each funnel report must include a “Base Cohort” step. This step is the requirement for contacts to enter into the funnel report. By default, the Base Cohort step will include any contact in your CRM created within the last 30 days. You may modify the Base Cohort step as needed to bring in a more specific cohort.
Additional Funnel Steps
Once you have your “Base Cohort” step, configure up to 5 additional steps to track contacts who enter into the Base Cohort step. To maximize reporting, it’s important to configure your steps as closely as possible to a current funnel you’re currently running via your marketing tools. It’s likely your marketing funnel will consist of more than 6 touch points. In those cases, you’ll want to consider your most important milestones and include those in the funnel report steps.
Each forward moving step in the funnel is dependent on the previous step, meaning a contact cannot move forward to the next step unless they’ve satisfied the previous step. It is not possible for a contact to skip through any steps in the funnel.
Understanding The Funnels Report Metrics
With Funnels reports SegMetrics returns 5 key performance indicators (KPIs) that we believe to be the most important:
- Leads: The number of contacts who have performed each step of the funnel
- Revenue: The amount of money created by contacts at each step of the funnel
- Lead Value: The amount of revenue divided by the number of contacts at each step of the funnel
- Average Order Value (AOV): The Average Order value at each step of the funnel
- Orders: The number of orders from contacts at each step of the funnel have created
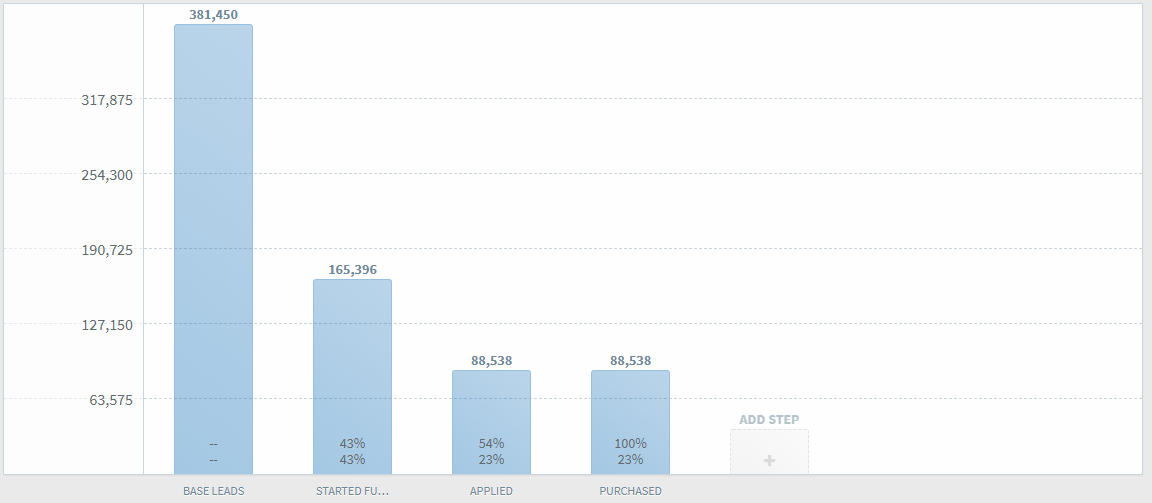
The Funnel Graph shows a visual representation of how the metrics change over each step in the funnel, and the percentage of change, both from the previous step as well as compared to the funnel overall.
The following funnel graph shows that the number of leads who purchased is 23% of all contacts who joined the funnel, but an amazing 100% of leads who completed the "applied" step also purchased.