Dashboard Nurture
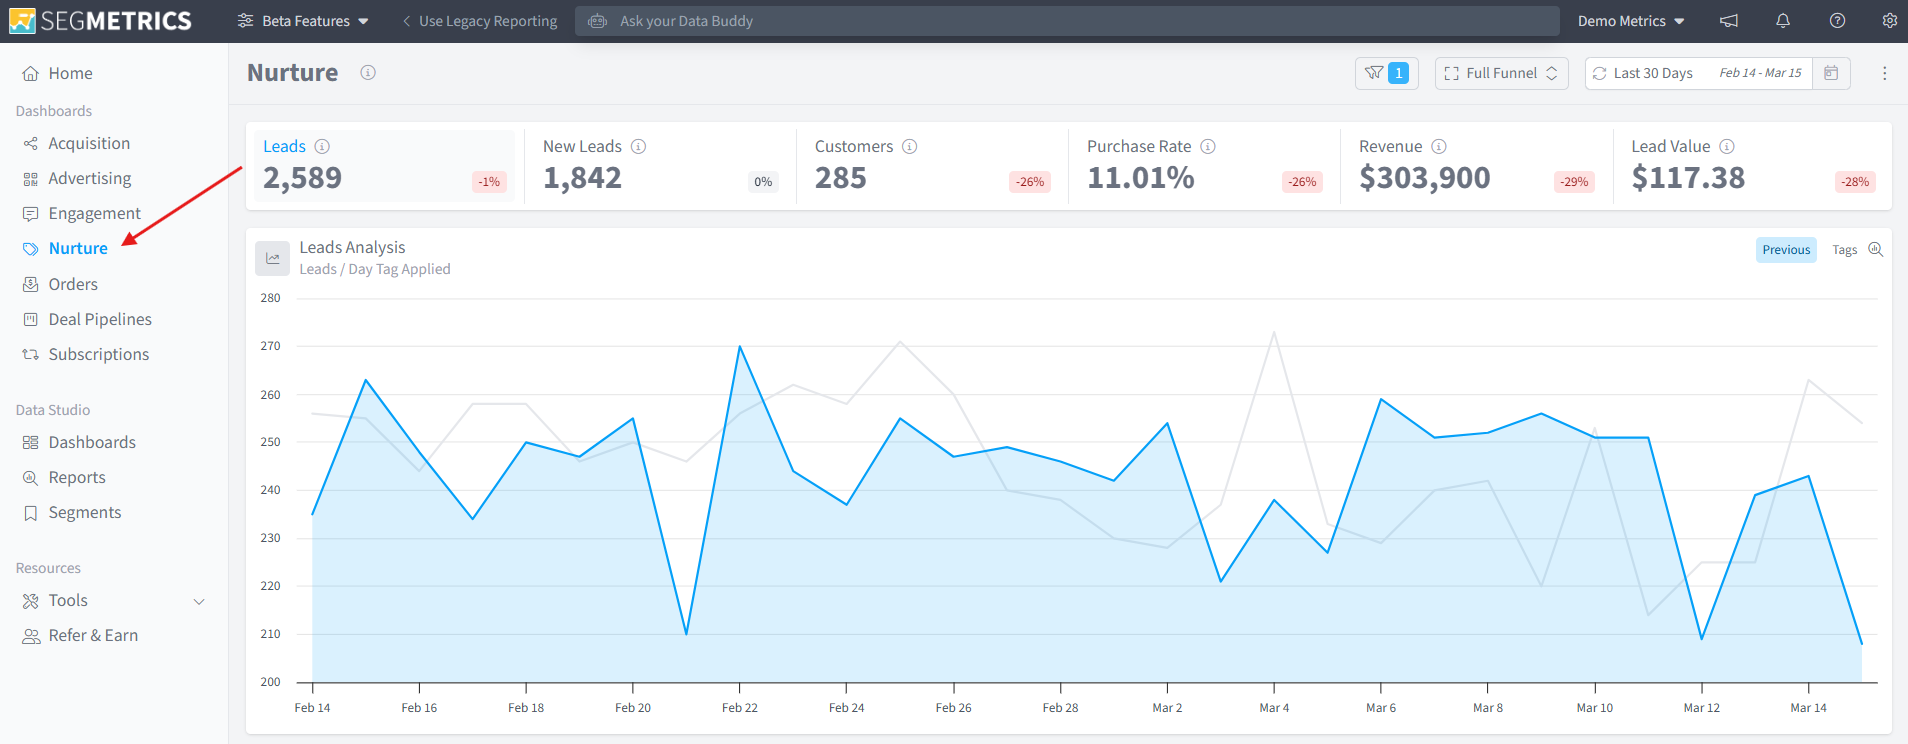
The Nurture dashboard helps you track contacts through your marketing automation workflows. It gives you a clear view of how leads move through your nurture sequences, which tags and funnels are driving conversions, and how quickly leads become customers after a specific action is taken.
To access it, click Nurture in the left-hand navigation menu.
Key Metrics
At the top of the Nurture dashboard, you will find a summary of the most important metrics for the selected date range:
- Leads - the total number of contacts in your nurture workflows during the period.
- New Leads - the number of new contacts who entered your nurture sequences for the first time.
- Customers - the number of leads who converted to paying customers.
- Purchase Rate - the percentage of leads who made a purchase.
- Revenue - the total revenue generated by leads in your nurture workflows.
- Lead Value - the average revenue value of each lead.
Each metric includes a percentage change indicator comparing the current period to the previous one, so you can quickly see whether performance is improving or declining.
Filtering the Nurture Dashboard
You can narrow down your Nurture data using the Filters panel, accessible from the filter icon in the top right of the dashboard. Filters are organized into the following categories:
- Contact - filter by contact properties such as name, email, or location.
- Tags & Lists - filter by specific tags or list memberships applied to contacts.
- Deals - filter by deal stage or pipeline activity.
- Orders - filter by order history, product, or purchase value.
- Subscriptions - filter by subscription status or plan.
- Page Views - filter by pages visited by contacts.
- Ads - filter by ad source or campaign.
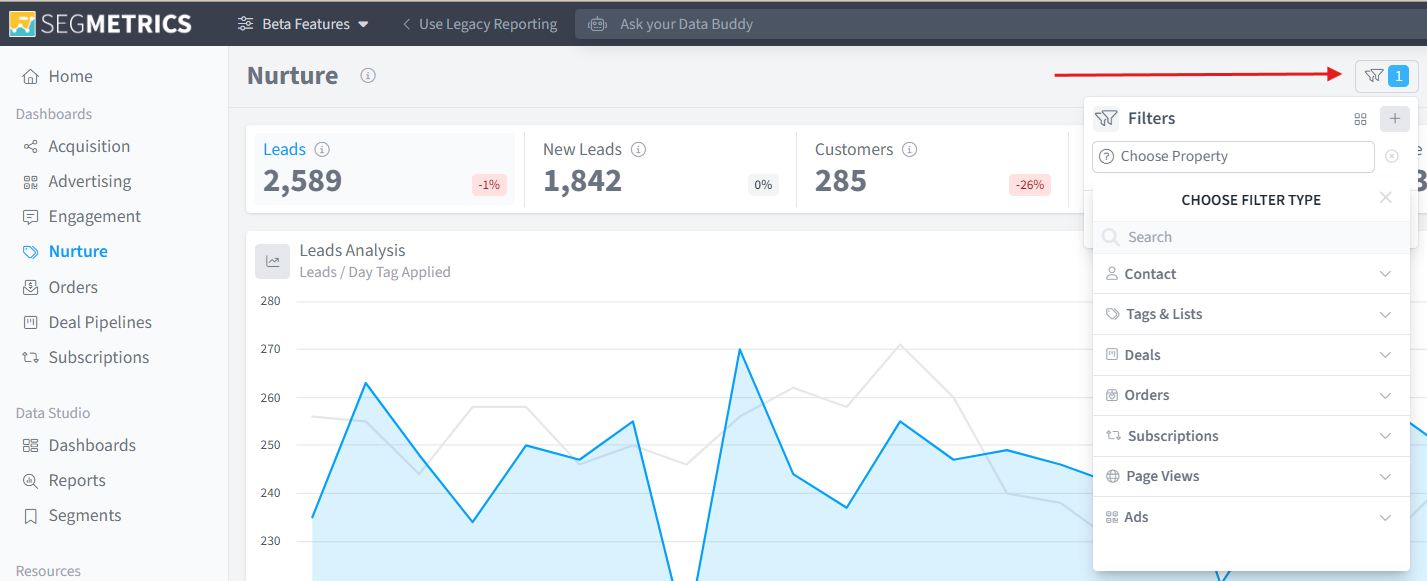
Applying filters lets you isolate specific segments of your audience, such as everyone who received a particular tag, entered a specific funnel, or came from a certain ad campaign, so you can analyze their nurture performance in isolation.
Tagging Orbit
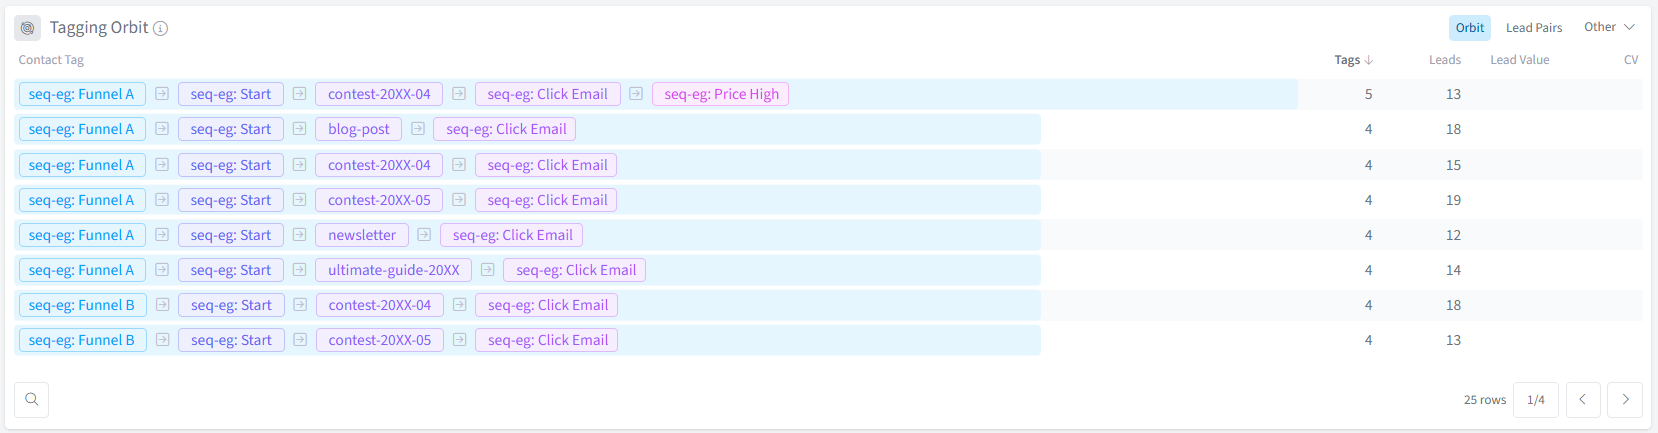
The Tagging Orbit section shows which combinations of contact tags are contributing to lead conversions. Each row represents a unique group of contacts who share the same combination of tags, along with the number of leads, lead value, and conversion value (CV) for that group.
This view is particularly useful for identifying which tag sequences, funnels, and content sources are working together to drive the most conversions. You can switch between the Orbit, Lead Pairs, and Other views using the tabs in the top right of the section.
Velocity
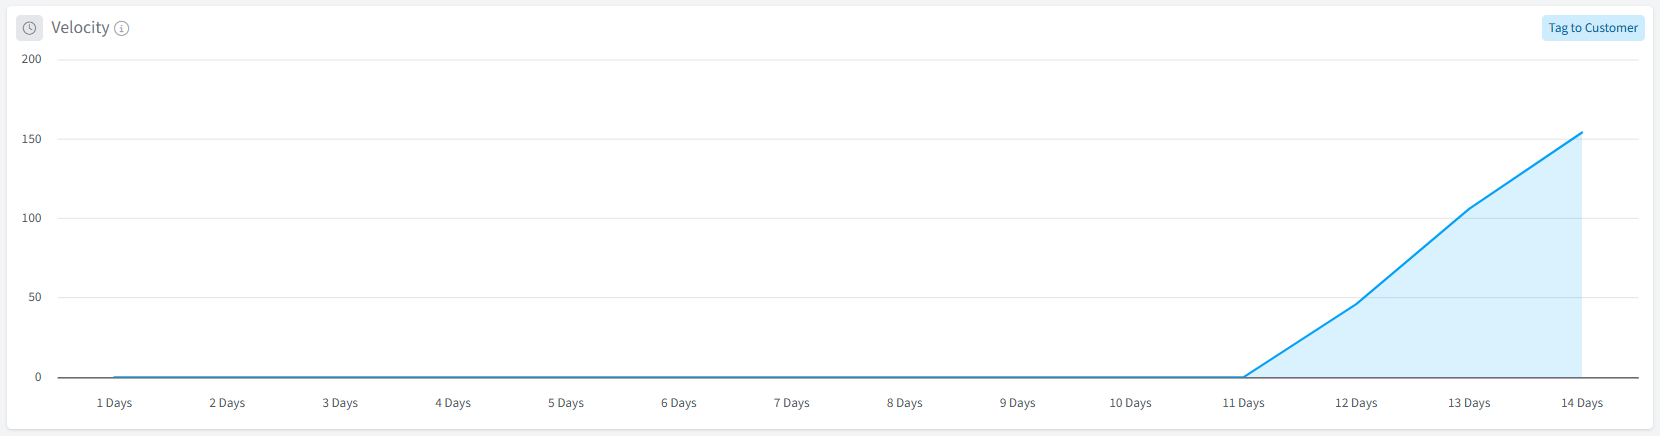
The Velocity chart tracks how long it takes for leads to convert to customers after a tag is applied. The horizontal axis shows the number of days since the tag was applied, and the vertical axis shows the cumulative number of conversions over that time.
This is especially useful when you are filtering by a specific tag, as it lets you measure how quickly that tag influences a purchasing decision. You can toggle the view between Tag to Customer and other conversion windows using the button in the top right of the section.
Frequently Asked Questions
Q: What is the Nurture dashboard used for?
A: The Nurture dashboard is designed to help you track how contacts move through your marketing automation workflows. It shows you key metrics like lead volume, purchase rate, and revenue, as well as deeper insights into which tag combinations are driving conversions and how quickly leads are converting after specific actions.
Q: What does the Tagging Orbit show?
A: The Tagging Orbit shows unique combinations of contact tags and the leads, lead value, and conversion value associated with each group. It helps you identify which sequences of tags and content sources are working together to drive the most conversions.
Q: What does the Velocity chart measure?
A: The Velocity chart tracks the time it takes for leads to convert to customers after a tag is applied. It shows cumulative conversions over a number of days, giving you a clear picture of how quickly a given tag or action influences purchasing behavior.
Q: How do I filter the Nurture dashboard by a specific funnel or tag?
A: Click the filter icon in the top right of the dashboard to open the Filters panel. From there, expand the Tags & Lists category and select the tag or list you want to filter by. You can combine multiple filters across different categories to narrow your results further.
Q: Can I compare the current period to a previous one?
A: Yes. Each key metric at the top of the dashboard includes a percentage change indicator that automatically compares the current date range to the equivalent previous period. You can adjust the date range using the date picker in the top right of the dashboard.
Q: What is the difference between Leads and New Leads?
A: Leads represents the total number of contacts active in your nurture workflows during the selected period, including those who entered before the period began. New Leads counts only contacts who entered your nurture sequences for the first time within the selected date range.