Dashboard Orders
The Orders dashboard helps you analyze order performance and conversion channels. It gives you a complete view of how many orders are being placed, which products and channels are driving the most revenue, and how your customers are segmented across your funnels.
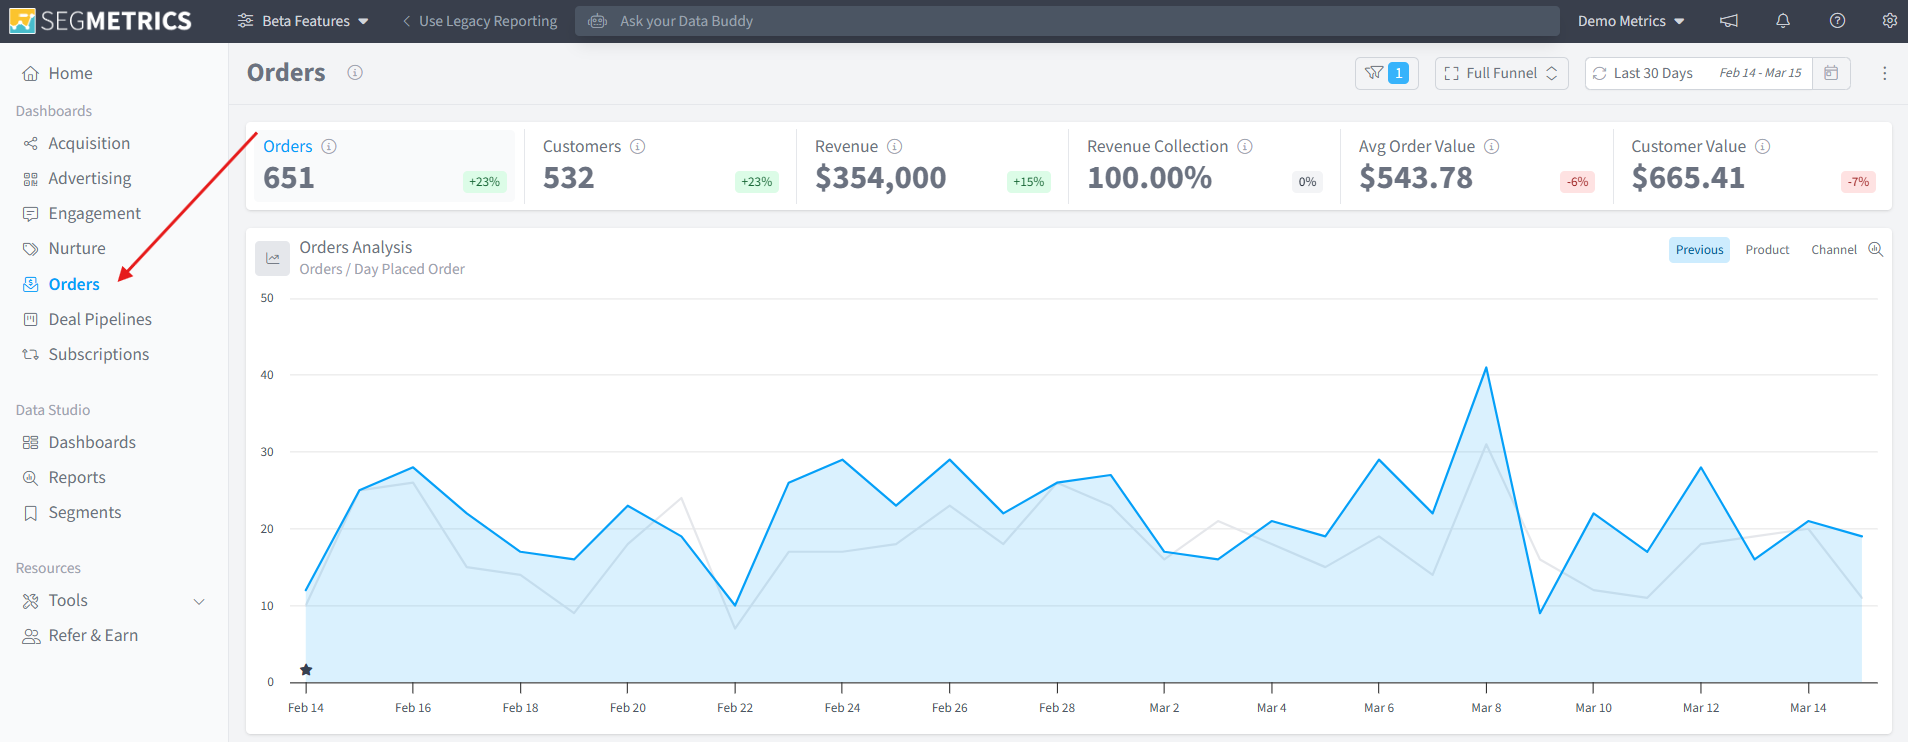
To access it, click Orders in the left-hand navigation menu.
Key Metrics
At the top of the Orders dashboard, you will find a summary of the most important metrics for the selected date range:
- Orders - the total number of orders placed during the period.
- Customers - the number of unique customers who placed an order.
- Revenue - the total revenue generated from all orders.
- Revenue Collection - the percentage of expected revenue that has been successfully collected.
- Avg Order Value - the average dollar value per order.
- Customer Value - the average total value of each customer across all their orders.
Each metric includes a percentage change indicator comparing the current period to the previous one, giving you a quick read on whether performance is trending up or down.
The Orders Analysis chart below the metrics shows the daily order volume over the selected date range, with a grey line representing the previous period for easy comparison. You can toggle between Previous, Product, and Channel views using the tabs in the top right of the chart.
Filtering the Orders Dashboard
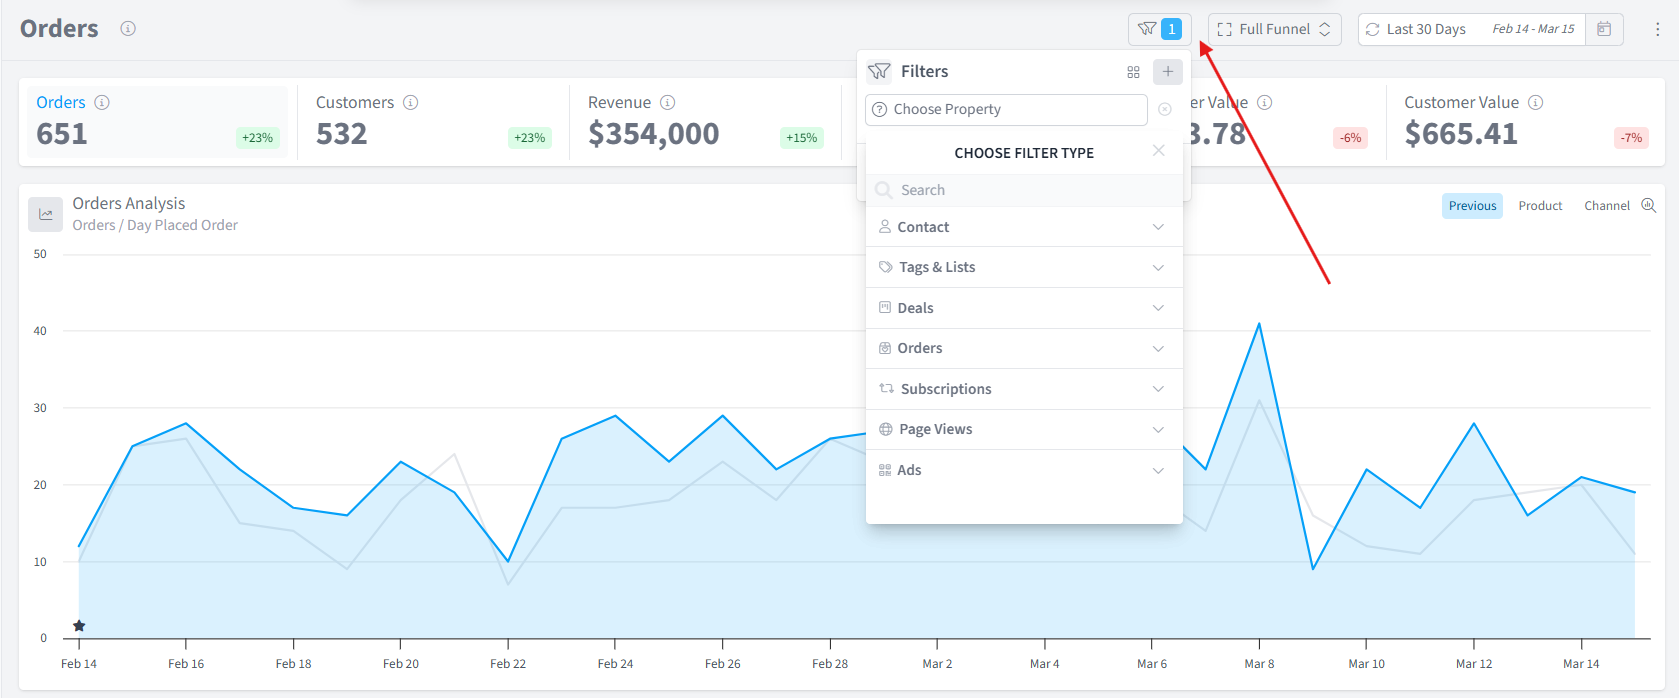
You can narrow down your Orders data using the Filters panel, accessible by clicking the filter icon in the top right of the dashboard. When a filter is active, a blue indicator will appear on the filter icon showing how many filters are currently applied.
Filters are organized into the following categories:
- Contact - filter by contact properties such as name, email, or location.
- Tags & Lists - filter by specific tags or list memberships applied to contacts.
- Deals - filter by deal stage or pipeline activity.
- Orders - filter by order history, product, or purchase value.
- Subscriptions - filter by subscription status or plan.
- Page Views - filter by pages visited by contacts.
- Ads - filter by ad source or campaign.
Combining filters lets you drill into specific slices of your order data, such as all orders from paid traffic that purchased a specific product, or all customers with a certain tag who placed an order within the date range.
Top Products
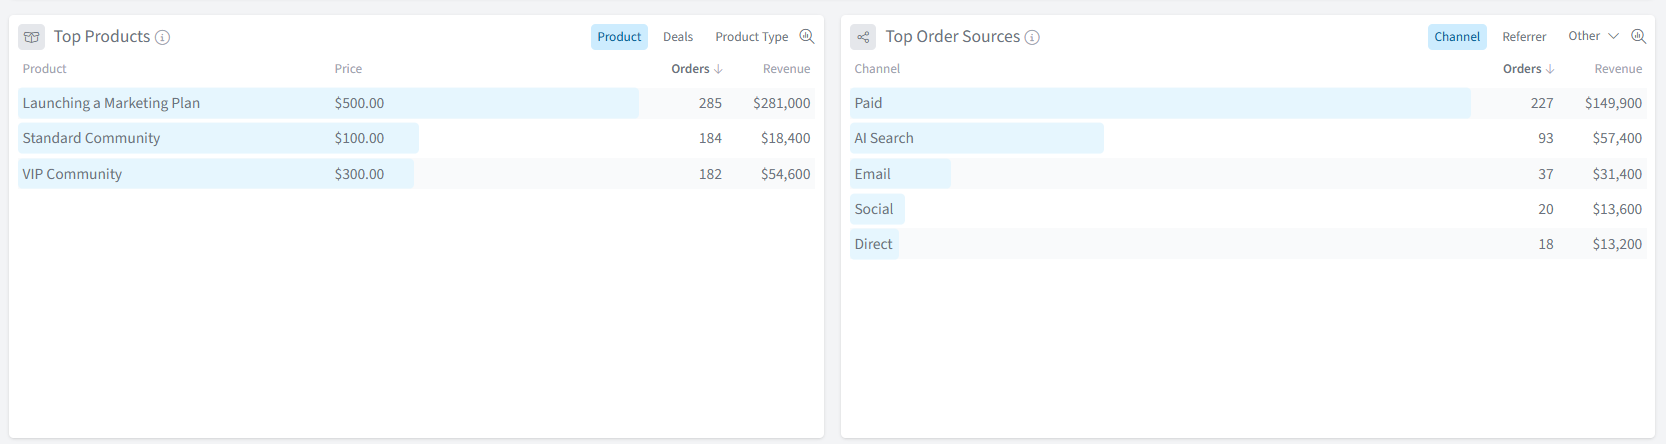
The Top Products table shows which products are generating the most orders and revenue during the selected period. Each row displays the product name, price, total orders, and total revenue.
You can switch between Product, Deals, and Product Type views using the tabs in the top right of the section to analyze performance from different angles.
Top Order Sources
The Top Order Sources table shows which channels are driving the most orders and revenue. Channels include Paid, AI Search, Email, Social, and Direct, ranked by order volume.
You can switch between Channel, Referrer, and Other views to explore attribution from different perspectives.
Customer Segments
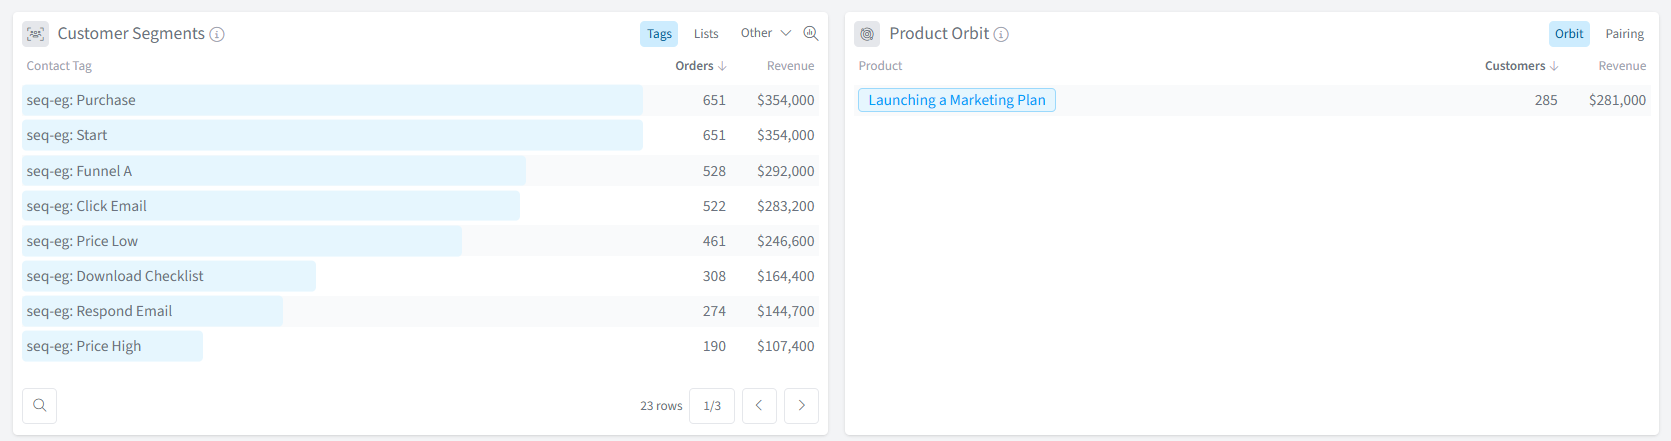
The Customer Segments section breaks down orders and revenue by contact tag, list, or other segmentation properties. This helps you understand which segments of your audience are purchasing most frequently and generating the most revenue.
Use the Tags, Lists, and Other tabs to switch between different segmentation views.
Product Orbit
The Product Orbit section shows which products customers are buying, along with the number of customers and revenue attributed to each. You can switch to the Pairing view to see which products are most commonly purchased together.
Frequently Asked Questions
Q: What is the Orders dashboard used for?
A: The Orders dashboard is designed to help you analyze order performance and conversion channels. It shows you key metrics like total orders, revenue, and average order value, and lets you dig into which products, channels, and customer segments are driving the most sales.
Q: What is the difference between Revenue and Revenue Collection?
A: Revenue is the total value of all orders placed during the period. Revenue Collection is the percentage of that expected revenue that has actually been collected, which is useful for spotting any payment failures or outstanding amounts.
Q: What is the difference between Avg Order Value and Customer Value?
A: Avg Order Value is the average dollar amount of a single order. Customer Value is the average total revenue generated per unique customer across all of their orders, giving you a broader picture of long-term customer worth.
Q: What does the Product Orbit Pairing view show?
A: The Pairing view in Product Orbit shows which products are most commonly purchased together by the same customers. This is useful for identifying natural upsell and cross-sell opportunities within your product catalog.
Q: How do I see which channel is driving the most revenue?
A: Scroll down to the Top Order Sources section and make sure the Channel tab is selected. This will rank your channels by order volume and revenue, so you can see at a glance whether Paid, Email, Social, or another channel is performing best.
Q: Can I filter the dashboard by a specific product or tag?
A: Yes. Click the filter icon in the top right of the dashboard to open the Filters panel. Select Orders to filter by product, or Tags & Lists to filter by a contact tag. You can combine multiple filters to narrow your results further.