Revenue Reports
Revenue reports are reports which focus on your transaction data within a specified date range. Get better insight into which products are driving your revenue.
By default, when you run a new Revenue report, the report returns key performance indicators related to the cohort for the last 30 days.
To run a new revenue report
- From the left sidebar, click Revenue
- Apply filters to return revenue data
Once you’ve got your base Revenue report, you can apply a number of different filters to return the data points you’d like to view.

To add additional filters to your Revenue report:
- Click + Add Report Filter
- Select the filter(s) you’d like to apply
- Click Apply Filters
Once you’ve applied your new filter(s), the report will return only the relevant cohort data in your account from the specific date range.
Looking for more clarity on report filters? Check out our Filter Dictionary to learn more about what each filter returns.
Understanding The Revenue Report Metrics
When you run a Revenue report, SegMetrics returns 5 key performance indicators (KPIs) that we believe to be the most important:
- Customers: any contacts that fit the report filters who have also purchased a product that fits the report filters.
- Revenue: the amount of money that you will make if all invoices are paid in full, otherwise known as sales. Collected Revenue can be found under the "Collections" report.
- Orders: the number of distinct Invoices that were created during this timeframe. A single order may contain multiple Invoice Items.
-
Average Order Value (AOV): displays how much customers are normally spending with you when they make a purchase. Increasing your AOV is a great way to increase revenue without having to improve lead generation or conversion rate. One-Click Upsells and Upgrades are a great way to increase your AOV.
- Calculation: Revenue/Number of invoices
-
Customer Value: a calculation of the revenue that customers in this report have generated, from purchases in this report. Understanding your Customer Value helps you know how much you can expect to generate from every new customer you bring in.
- Calculation: Revenue/Number of customers
Save Your Revenue Report
When you save your revenue report, the report can be quickly accessed from the Saved Reports area in your account. The report will save all applied filters.
To save your report:
- From the top of the report, click Save
- Give the report a descriptive name
- Select the Preview KPI
- Select either Timespan or Rolling
- Click Save Report
To access your saved reports, click "Saved Reports" from the left sidebar in your account.
Table vs. Chart Report Views
Beyond the 5 KPIs displayed in your Revenue reports, the report also returns that data at a more granular level. Directly below the KPIs, you’ll notice the report can be broken down into either a Table or Chart (default) view.
Chart View:
The Chart is a visualization of the data returned from the report cohort. Since this is a Revenue report, the chart defaults to a line chart that displays your total revenue acquisition for the date range set in the report. By default the chart breaks revenue down by “Day” for the date range in the report.

You can use the filter drop-down to switch up the data you’d like to view. Switching up the filters in the chart will not affect the 5 KPIs returned in the report.

Table View:
The Table view in your Revenue report breaks your metrics down even further. When you click into the table view, the data will display the individual products attributed to the cohort.
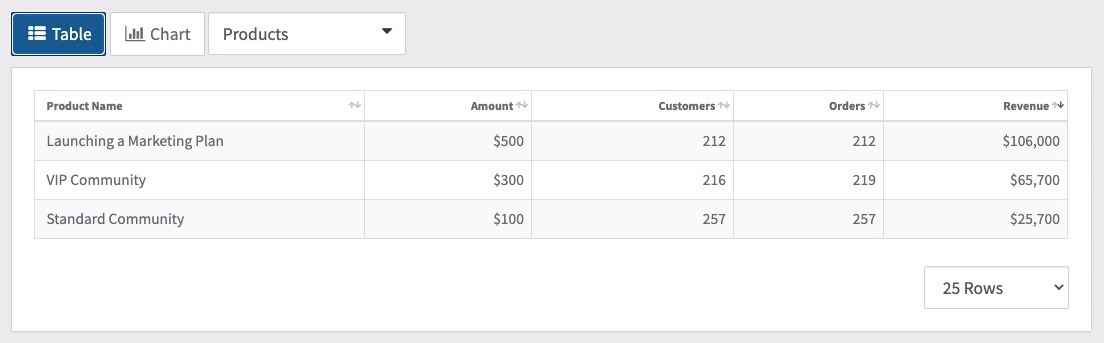
You can switch up the data displayed inside of the report table by modifying the filter located at the top of the table.

FULL TRANSCRIPT:
Want to confirm the revenue you're seeing in segments
matches your expectations.
All revenue comes from your connected email platform
or revenue processors,
but different reports show different views of that revenue.
Let's understand what each one means
in the acquisition report.
The revenue you see is from new customers only,
meaning any revenue earned from customers who were brand new
to your list within the report's date range.
If someone was already on your list before the date range
and purchased during it, they won't show here.
This report is great to answer the question of
how much revenue did I generate from
newly acquired customers?
Perfect for measuring your acquisition marketing
effectiveness in the advertising report,
the revenue you see is the revenue earned from customers
who clicked an ad in the time period of the report.
Regardless of how long those contacts have been on your
email list, the important thing to remember here is
that the ad click must happen
before the purchase for those customers
and revenue to show on the report.
Let's say you're viewing the report for last month.
This will show any lead
and customer who clicked an ad in that timeframe,
and the revenue is coming from any customer
who made a purchase after the ad click.
Even if the purchase happened in the following month
or months, that revenue would show in the date range
that the click happened,
even if the purchase happened past the selected date range.
This revenue then gets calculated into the ROI
and customer acquisition cost.
You see on the report, in the orders report,
the revenue you see here is all revenue
earned in that time period.
Regardless of how long those contacts have been on your
email list, new customer,
or long time subscriber,
if they purchase in this date range, they're included.
This should closely match the total revenue you see in your
connected revenue processors like Stripe, PayPal,
or your e-commerce platforms.
Use this report to verify your overall revenue
numbers for that date range.
If you have multiple revenue processors connected,
say Stripe and PayPal.
The revenue shown is the combined total from all
connected processors.
Want to see each processor individually?
Add a filter to the report, select the orders.
Filter now, select the order integration filter.
Then choose the specific processor you want to view.
Now you'll see only Stripe or PayPal
or whichever processor you selected.
Compare each processor individually against your actual
processor dashboards to verify accuracy
and spot any discrepancies.
Build confidence in your data by understanding
what each report shows
and verifying it matches your revenue.
Processors catch discrepancies early
and ensure your marketing decisions are based on accurate
numbers.