Contacts Report
The Contacts report is your gateway to the data you’ve been collecting about your contacts and leads. View and segment contacts from your marketing channels to compare which of those channels are performing well or not so well.
By default, when you run a new Contacts report, the report returns key performance indicators related to the cohort for the last 30 days.
To run a new Contacts report:
- From the left sidebar, click Contacts
- Apply filters to return the report data
Once you’ve got your base report, you can apply a number of different filters to return the data points you’d like to view.
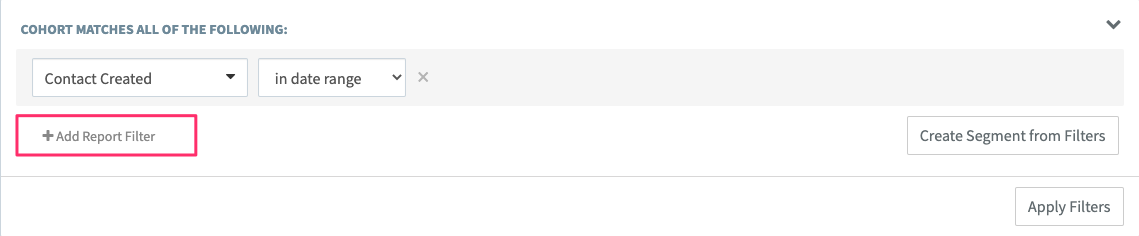
To add additional filters to your Contacts report:
- Click + Add Report Filter
- Select the filter(s) you’d like to apply
- Click Apply Filters
Once you’ve applied your new filter(s), the report will return only the contacts in your account who fit the applied criteria.
Looking for more clarity on report filters? Check out our Filter Dictionary to learn more about what each filter returns.
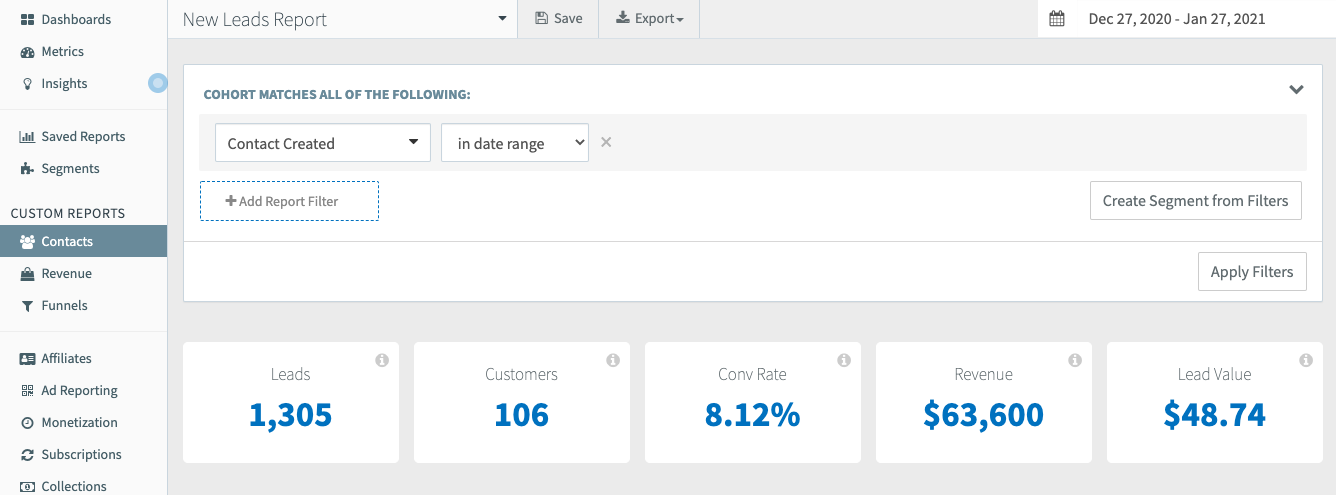
Understanding The Contacts Report Metrics
When you run a Contacts report SegMetrics returns 5 key performance indicators (KPIs) that we believe to be the most important:
- Leads: the number of contacts that fit the search conditions. If you are filtering by contacts created in this date range, this is the number of new contacts that have been added to your account during the report date range.
- Customers: any contacts that fit the report filters who have also purchased a product that fits the report filters.
- Conversion Rate: measures of how effective you are at turning your Leads into Customers. The higher this number, the more effective your marketing funnels are.
- Revenue: the amount of money that you will make if all invoices are paid in full, otherwise known as sales. Collected Revenue can be found under the "Collections" report.
-
Lead Value: measures how valuable your new Leads are. Measuring the Lead Value for different Lead Sources, Campaigns or Touchpoints is an important way to determine how much you can spend to acquire a new lead, and how effective your marketing funnels are.
- Calculation: Revenue/Number of contacts
Save Your Contact Report
When you save your contact report, the report can be quickly accessed from the “Saved Reports” area in your account. The report will save all applied filters.
To save your report:
- From the top of the report, click Save
- Give the report a name
- Select the Preview KPI
- Select either Timespan or Rolling
- Click Save Report
To access your saved reports, click "Saved Reports" from the left sidebar in your account
Table vs. Chart Report Views
Beyond the 5 KPIs displayed in your Contacts reports, the report also returns that data at a more granular level. Directly below the KPIs, you’ll notice the report can be broken down into either a Table or Chart (default) view.
Chart View:
The Chart is a visualization of the data returned from the report cohort. Since this is a Contacts report, the chart defaults to a line chart that displays how your leads acquisition has performed over the date range set in the report.

You can use the filter drop-down to switch up the data you’d like to view. Switching up the filters in the chart will not affect the 5 KPIs returned in the report.

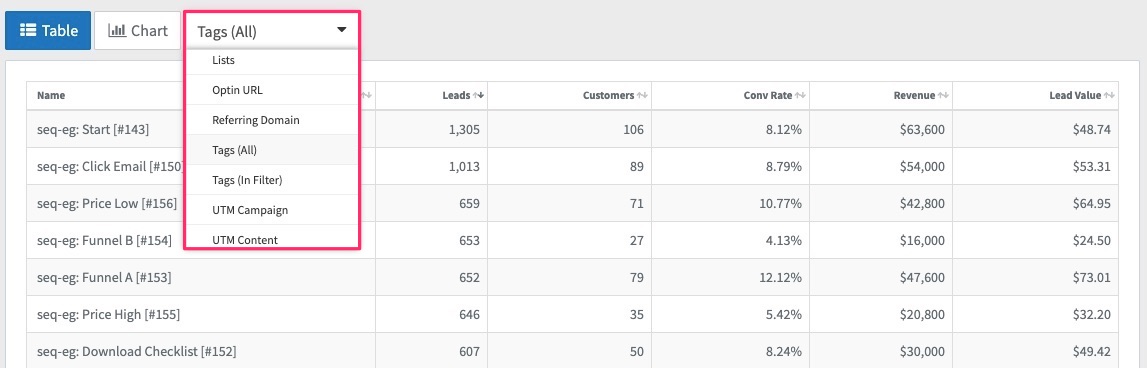
Table View:
The Table view in your contacts report breaks your metrics down even further. When you click into the table view, the report breaks your metrics down by the tags you’ve applied to your contacts in your CRM.
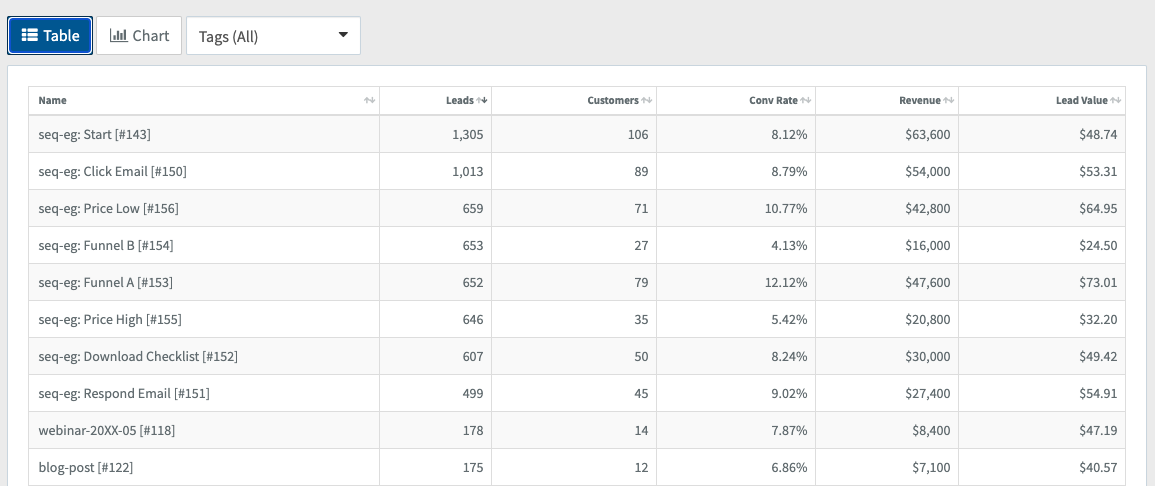
You can switch up the data displayed inside of the report table by modifying the filter located at the top of the table.