Deal Pipeline Report
The Deal Pipeline Report provides insight into the status of your deals. View metrics in regards to open, won, and lost deals, as well as the revenue that you’ve won and revenue that is still outstanding.
Run a New Deal Pipeline Report
By default, when you run a new Deal Pipeline report, the report returns key performance indicators related to the last 30 days.
To run a new Deal Pipeline report:
- From the left sidebar, click Deal Pipeline
- Apply filters to return the report data you’d like to view
Once you’ve got your base report, you can apply a number of different filters to return the data points you’d like to view.
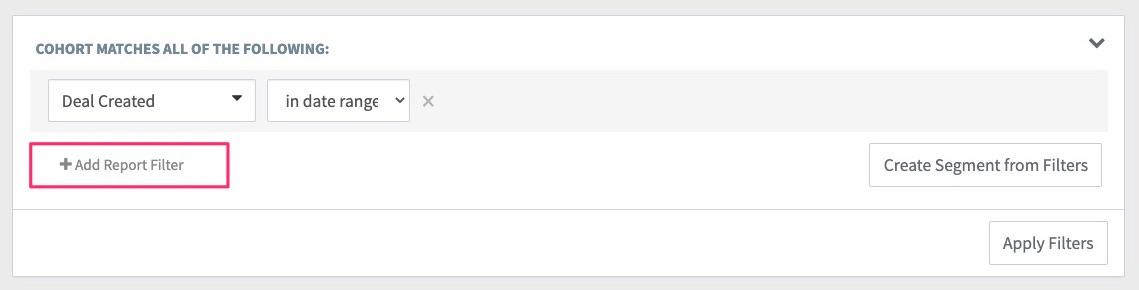
To add additional filters to your Deal Pipeline report:
- Click + Add Report Filter
- Select the filter(s) you’d like to apply
- Click Apply Filters
Once you’ve applied your new filter(s), the report will return only the metrics related to contacts in your account who fit the applied cohort criteria.
Looking for more clarity on report filters? Check out our Filter Dictionary to learn more about what each filter returns.
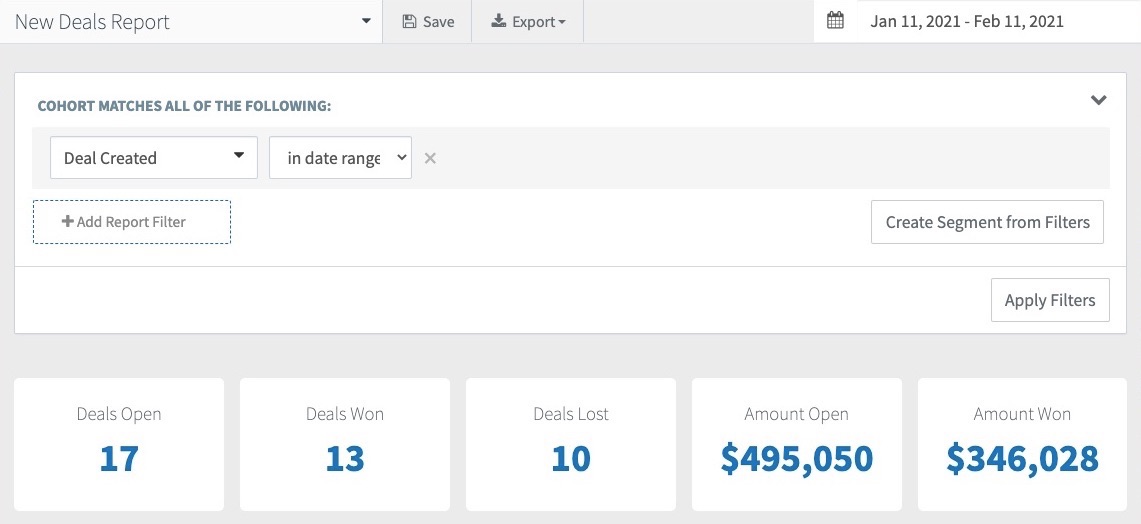
Understanding The Deal Pipeline Report Metrics
When you run a Deal Pipeline report SegMetrics returns 5 key performance indicators (KPIs) that we believe to be the most important:
- Deals Open: The total number of deals that are open. These are deals that have not yet been won within the specified time frame.
- Deals Won: The total number of deals that have been won within the specified time frame.
- Deals Lost: The total number of deals that have been lost within the specified time frame.
- Amount Open: The amount of revenue that is still open and has not yet been collected from won deals.
- Amount Won: The total amount of revenue that has been collected from won deals.
Save Your Deal Pipeline Report
When you save your Deal Pipeline report, the report can be quickly accessed from the Saved Reports area in your account. The report will save all applied filters.
To save your report:
- From the top of the report, click Save
- Give the report a name
- Select the Preview KPI
- Select either Timespan or Rolling
- Click Save Report
To access your saved reports, click "Saved Reports" from the left sidebar in your account
Table vs. Chart Report Views
Beyond the 5 KPIs displayed in your Deal Pipeline report, the report also returns that data at a more granular level. Directly below the KPIs, you’ll notice the report can be broken down into either a Table or Chart (default) view.
Chart View:
The Chart is a visualization of the data returned from the report cohort. Since this is a Deal Pipeline report, the chart defaults to a line chart that displays how your lead value over time for the date range you’ve set in the report.
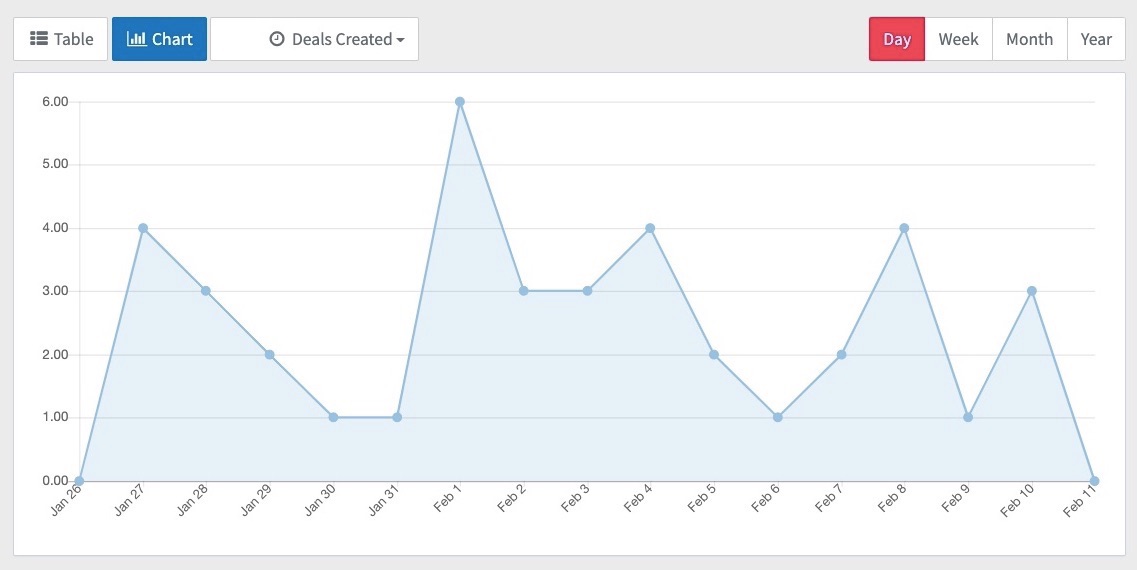
You can use the filter drop-down to switch up the data you’d like to view. Switching up the filters in the chart will not affect the 5 KPIs returned in the report.

Table View:
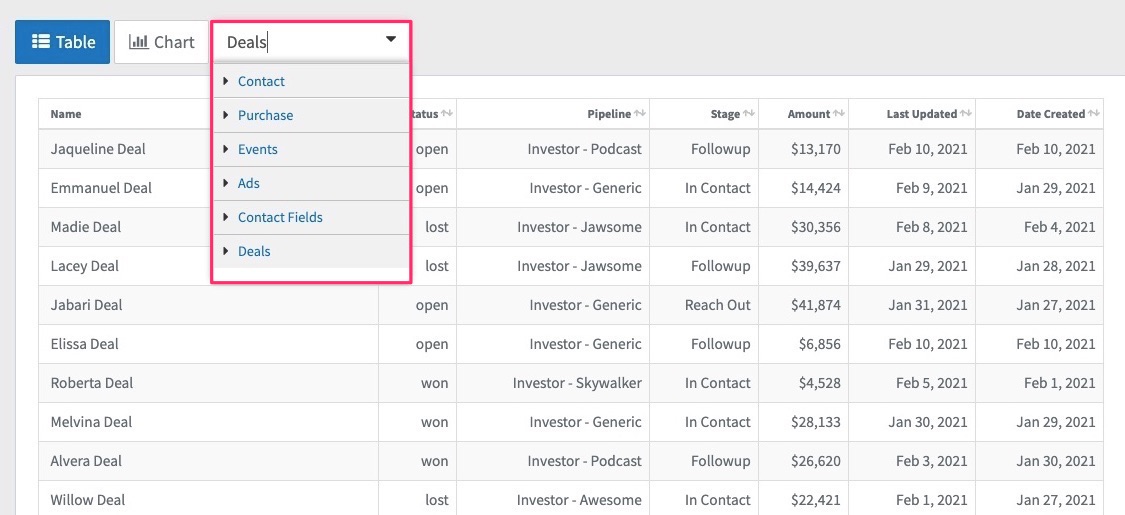
The Table view in your Deal Pipeline report breaks your metrics down even further. When you click into the table view, the report breaks your metrics down by different metrics based on the report cohort.
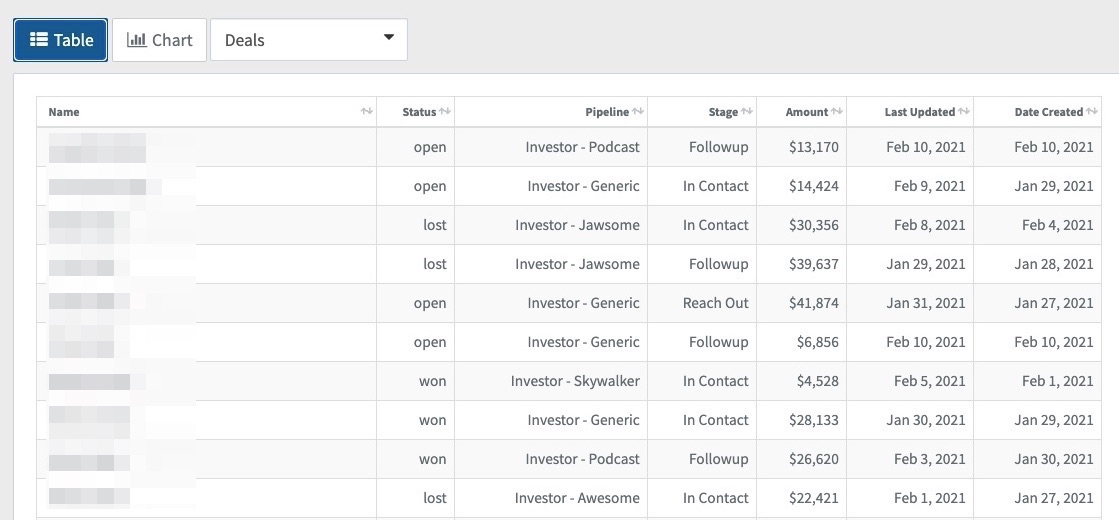
You can switch up the data displayed inside of the report table by modifying the filter located at the top of the table.