Subscriptions Report
The Subscriptions report is into how well your subscriptions are performing. See core metrics about your active, new, and canceled subscriptions, along with churn and monthly recurring revenue stats.
Run a New Subscriptions Report
By default, when you run a new Subscriptions report, the report returns key performance indicators related to the last 30 days.
To run a new Subscriptions report:
- From the left sidebar, click Subscriptions
- Apply filters to return the report data
Once you’ve got your base report, you can apply a number of different filters to return the data points you’d like to view.

To add additional filters to your Subscriptions report:
- Click + Add Report Filter
- Select the filter(s) you’d like to apply
- Click Apply Filters
Once you’ve applied your new filter(s), the report will return only the metrics related to contacts in your account who fit the applied cohort criteria.
Looking for more clarity on report filters? Check out our Filter Dictionary to learn more about what each filter returns.
Understanding The Subscriptions Report Metrics
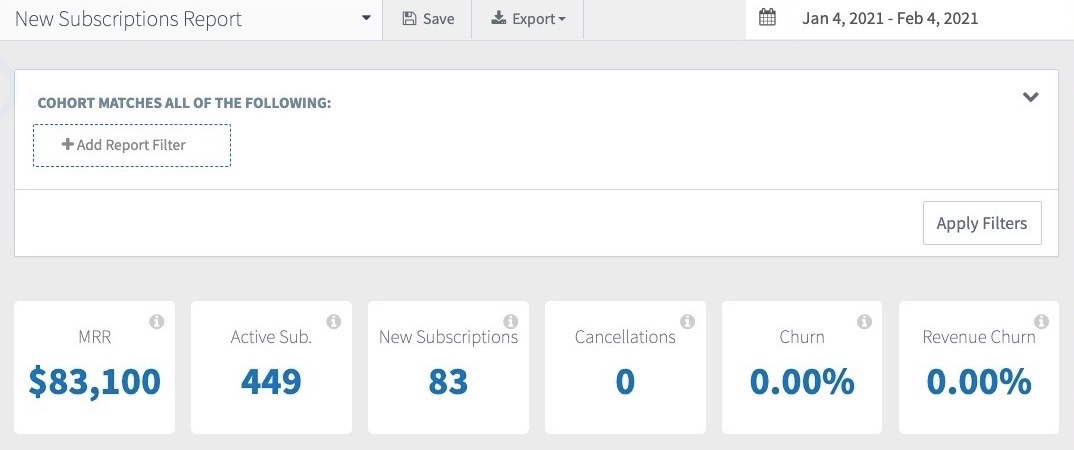
When you run a Subscriptions report SegMetrics returns 6 key performance indicators (KPIs) that we believe to be the most important:
- Monthly Recurring Revenue (MRR): MRR is one of the most important metrics for any company that offers subscriptions. MRR is the amount of revenue that your subscriptions generate on a recurring basis, normalized over a 30-day timespan.
- Calculation: Subscription Amount / Subscription Frequency (normalized to 30 days) IF Status is Active
- Active Subscriptions: The total number of active subscriptions that you currently have.
- Calculation: Number of Subscriptions IF Status is Active - New Subscriptions: The total number of active subscriptions that you've added during this timeframe.
- Calculation: Number of Subscriptions IF Status is Active AND StartDate >= Beginning of Report - Cancellations: The number of subscriptions that have expired during this timeframe. A subscription is active until the end of when it has been paid through, even if the subscription is cancelled earlier. For example, if a monthly subscription is canceled halfway through the month, it is still considered valid until the subscription reaches its end date.
- Calculation: Number of Subscriptions IF Status is Inactive AND PaidThruDate BETWEEN Beginning of Report & End of Report - Churn: User Churn is the percentage of subscriptions that have been canceled during this timeframe relative to the number of active subscriptions you had at the beginning of the report. New subscriptions created during the timeframe are not calculated in User Churn.
Calculation: (Canceled Subscription / Active Subscriptions BEFORE Beginning of Report that are still active) x 100 - Revenue Churn: Revenue Churn is the percentage of MRR that has been lost during this timeframe relative to your MRR at the beginning of the report. New subscriptions created during the timeframe are not calculated in Revenue Churn.
- Calculation: (MRR Lost from Cancelations BEFORE the Beginning of Report ÷ MRR at Beginning of Report) x 100
Save Your Subscriptions Report
When you save your subscription report, the report can be quickly accessed from the Saved Reports area in your account. The report will save all applied filters.
To save your report:
- From the top of the report, click Save
- Give the report a name
- Select the Preview KPI
- Select either Timespan or Rolling
- Click Save Report
To access your saved reports, click "Saved Reports" from the left sidebar in your account
Table vs. Chart Report Views
Beyond the 5 KPIs displayed in your Subscriptions report, the report also returns that data at a more granular level. Directly below the KPIs, you’ll notice the report can be broken down into either a Table or Chart (default) view.
Chart View:
The Chart is a visualization of the data returned from the report cohort. Since this is a Subscriptions report, the chart defaults to a line chart that displays how your new subscriptions acquisition has performed over the date range set in the report.

You can use the filter drop-down to switch up the data you’d like to view. Switching up the filters in the chart will not affect the 5 KPIs returned in the report.

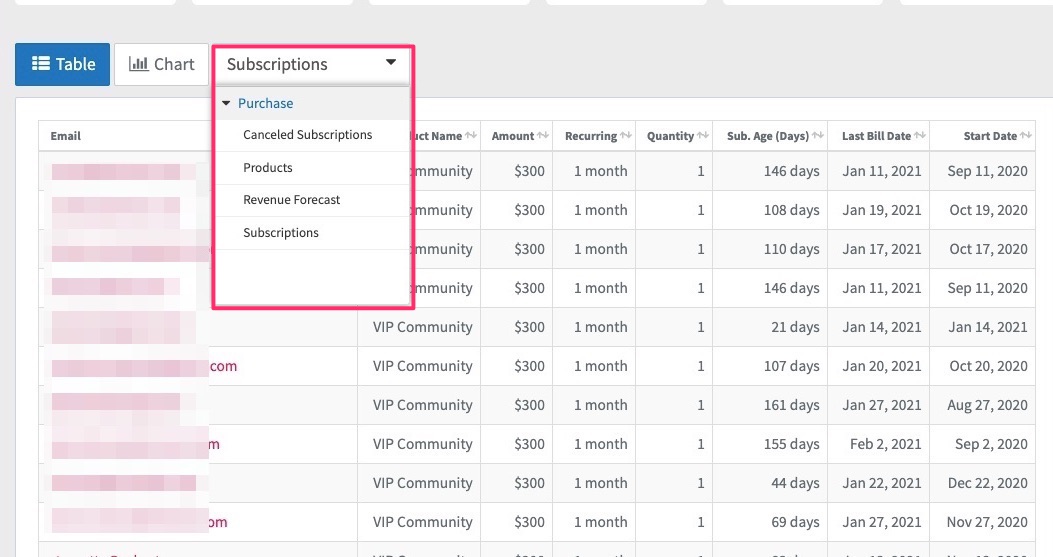
Table View:
The Table view in your Subscriptions report breaks your metrics down even further. When you click into the table view, the report breaks your metrics down by the contacts who have active subscriptions.

You can switch up the data displayed inside of the report table by modifying the filter located at the top of the table.