How To Create Custom Reports
In this documentation, we'll show you how to create customized reports in SegMetrics, our full-funnel marketing attribution tool designed for digital marketers and agencies. Customized reports allow you to view and segment your contacts with various filters and date ranges, enabling you to compare lead values, track marketing campaigns, and gain valuable insights into your marketing funnel. By learning how to create these reports, you'll have the power to make data-driven decisions that can boost your marketing success.
Main Topics Covered:
- Understanding the Purpose of Customized Reports
- Defining Filters and Date Range
- Utilizing KPIs and Charts
- Analyzing Data Breakdowns
- Accessing Contact Journeys and Audit Trails
- Saving, Exporting, and Reusing Reports
- References to Additional Support Documentation
- FAQ's and Gotchas
1.Understanding the Purpose of Customized Reports
Customized reporting allows you to keep a specific date range or set of filters tied to a specific report type. This creates quicker and easier access to the information you care about. You can then use any custom report in a widget on a dashboard. See other support documents below for more info on how to create dashboards.
2.Defining Filters and Date Range
- Start by opening up any report of your choice.
- Choose the date range you want the report to cover.
- Use filters to define the cohort of contacts you want to include. You can filter by various contact data, actions they've been tagged with, and even demographic data like their city.
- You have the option to save these filter combinations as a Segment for future use in other reports. See support article reference below on how to create/save a filter Segment.
3.Utilizing KPIs and Charts
- Once you've set your filters, click "Apply" to update the corresponding KPIs (Key Performance Indicators), charts, and tables.
- The KPIs will show essential metrics for your business, while the chart displays how these metrics change over time.
4.Analyzing Data Breakdowns
- The table breakdown is where the real magic happens. It lets you see your data divided up by any contact dimensions, not just as bulk averages.
- For example, you can choose "UTM source" to compare the number of new paying customers from each marketing channel. This insight helps you focus on high-performing channels and optimize your marketing strategy.
5.Accessing Contact Journeys and Audit Trails
- Select the "people symbol" in the top right corner of the table, to get a list of every contact that matches your filters.
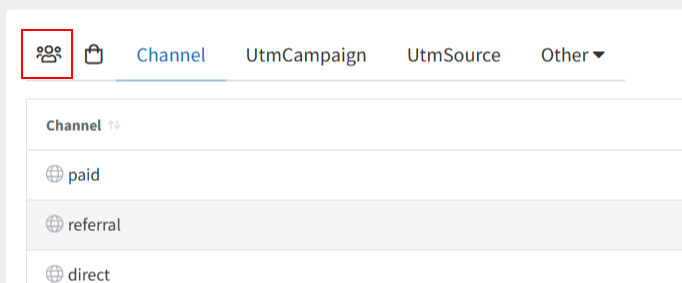
- Click on a contact email to view the complete journey history of that contact. This feature allows you to audit data and gain confidence in your insights.
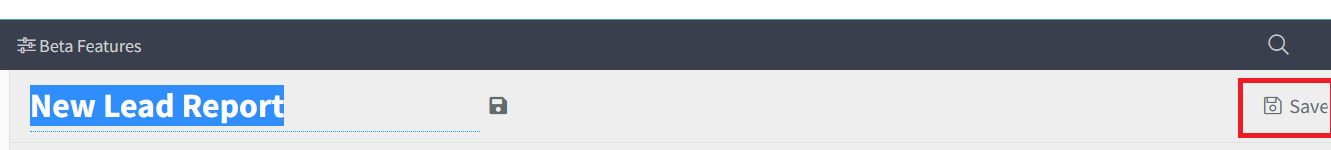
6.Saving, Exporting, and Reusing Reports
- Save the title of the report then click the save icon, in the top right next to the load button, to access it later or use it in dashboards for quick reference.
- Export the data as a CSV for further analysis outside of SegMetrics.
- You can also export the data as a retargeting list for use in other marketing platforms.
7.Reference to Other Support Documentation:
-For more information on advanced filtering options, check out our support article on "How to Create Segments in SegMetrics" .
-How to export reporting data into a CSV file.
-To see more on how to create dashboards read this article.
-If you’d like to include your custom reports as apart of your automated emails, click this article (pending publication).
8.FAQ / Gotchas:
Q: Can I combine multiple filters to create complex reports?
A: Absolutely! SegMetrics allows you to use multiple filters simultaneously to create detailed and specific reports.
Q: Can I edit or delete a saved report?
A: Yes, you can easily edit or delete saved reports from the "Custom Reports" section in the SegMetrics dashboard.
Q: Can I share my customized reports with team members?
A: Yes! You can download and share them as PDF’s or if they are a user within SegMetrics you can allow them to receive any custom reports in your automated emails that get sent out.
Q: Are there any limitations to the number of reports I can create?
A: There are no specific limitations on the number of reports you can create in SegMetrics. Feel free to generate as many reports as you need to analyze your marketing performance effectively.
Remember, customized reports offer valuable insights that can shape your marketing strategies, so don't hesitate to experiment and explore different filter combinations to uncover actionable data. Happy reporting!